Skip to content
logo
  • Services
  • References
  • News and insights
  • About us
  • Contact
Menu
  • Services
  • References
  • News and insights
  • About us
  • Contact
  • DA
  • EN
Search
Close this search box.
  • News and insights

Advanced Analytics

Advanced Analytics are AI and ML techniques that involve using complex algorithms and statistical models to extract insights and understanding from large amounts of data.

The purpose of Advanced Analytics is to discover patterns and trends that are not visible to the naked eye and then use these discoveries to make better decisions.

If you choose to have a solution designed by us, we will use a number of computer science and artificial intelligence techniques and tools to ensure the best possible solution to your needs. Our technical expertise includes areas such as Advanced Analytics, Machine Learning, Natural Language Processing (NLP) and Computer Vision, and we will often combine these techniques to achieve the most effective solution.

pie diagram
Classic diagram for visualization of data

Advanced Analytics - examples of use

Clustering

Analysing data allows you to identify clusters of data points that share common characteristics, helping you to understand customer preferences and behaviour. Customers can then be segmented based on their characteristics and behaviour, allowing you to tailor special offers and marketing strategies to them.

Graphical user interfaces

Dashboards and graphical user interfaces are effective tools for displaying Advanced Analytics results in a visually attractive and easy-to-understand way.

Dashboards and graphical user interfaces enable users to gain an immediate understanding of complex data analyses and trends, including various KPIs, warnings and reports.

Process optimisation

Analysing data allows you to identify inefficient processes and develop solutions to optimise these processes.

Overview and visualisation

With Advanced Analytics, it is possible to create an overview of data using visualisations. These visualisations show relationships in data.

By creating relationships in data, the data can be transformed into clear, valuable information.

Outlier detection

Analysing data allows you to identify outliers/deviations in your data. Outliers are data points that differ significantly from other data points in a data set. Deviations can be caused by a number of different factors, such as measurement errors, corrupt data, or actual deviations in the data. By identifying and removing deviations, the accuracy and quality of the analyses performed on the remaining data can be improved.

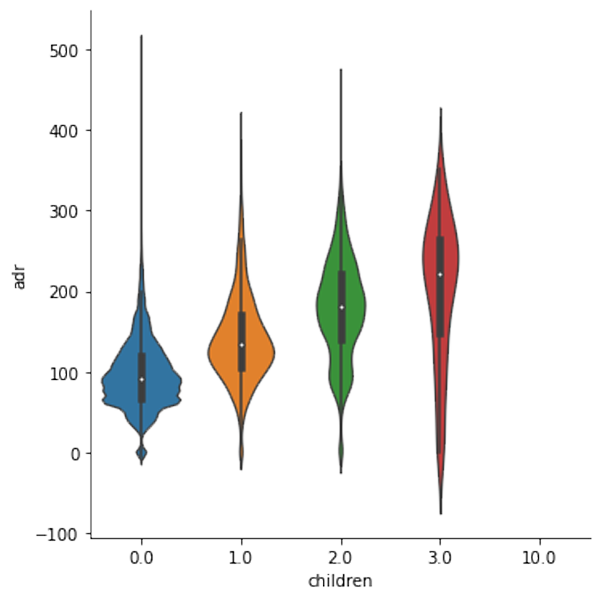
violin diagram
Example: usage analysis at a hotel / children
kontakt Ambolt AI

Book a non-binding advisor meeting

We are always ready to talk about your project – call us at +45 40 60 10 19. Or contact us here and we’ll get back to you.

logo
  • Ambolt ApS
  • Slotsgade 27
  • DK-9000
  • contact@ambolt.io
  • (+45) 40 60 10 19
  • VAT DK-37574929
Linkedin

© Ambolt 2023 All Rights Reserved

  • Services
  • References
  • News and insights
  • About us
  • Contact
  • For developers
  • Terms of use
  • Privacy